MORE INSIDE THE PLANT.MEASURED BY AN INDEPENDENT LAB.
Four trials, three crops, three laboratories. Every case states what was tested, what the lab measured and what changed.
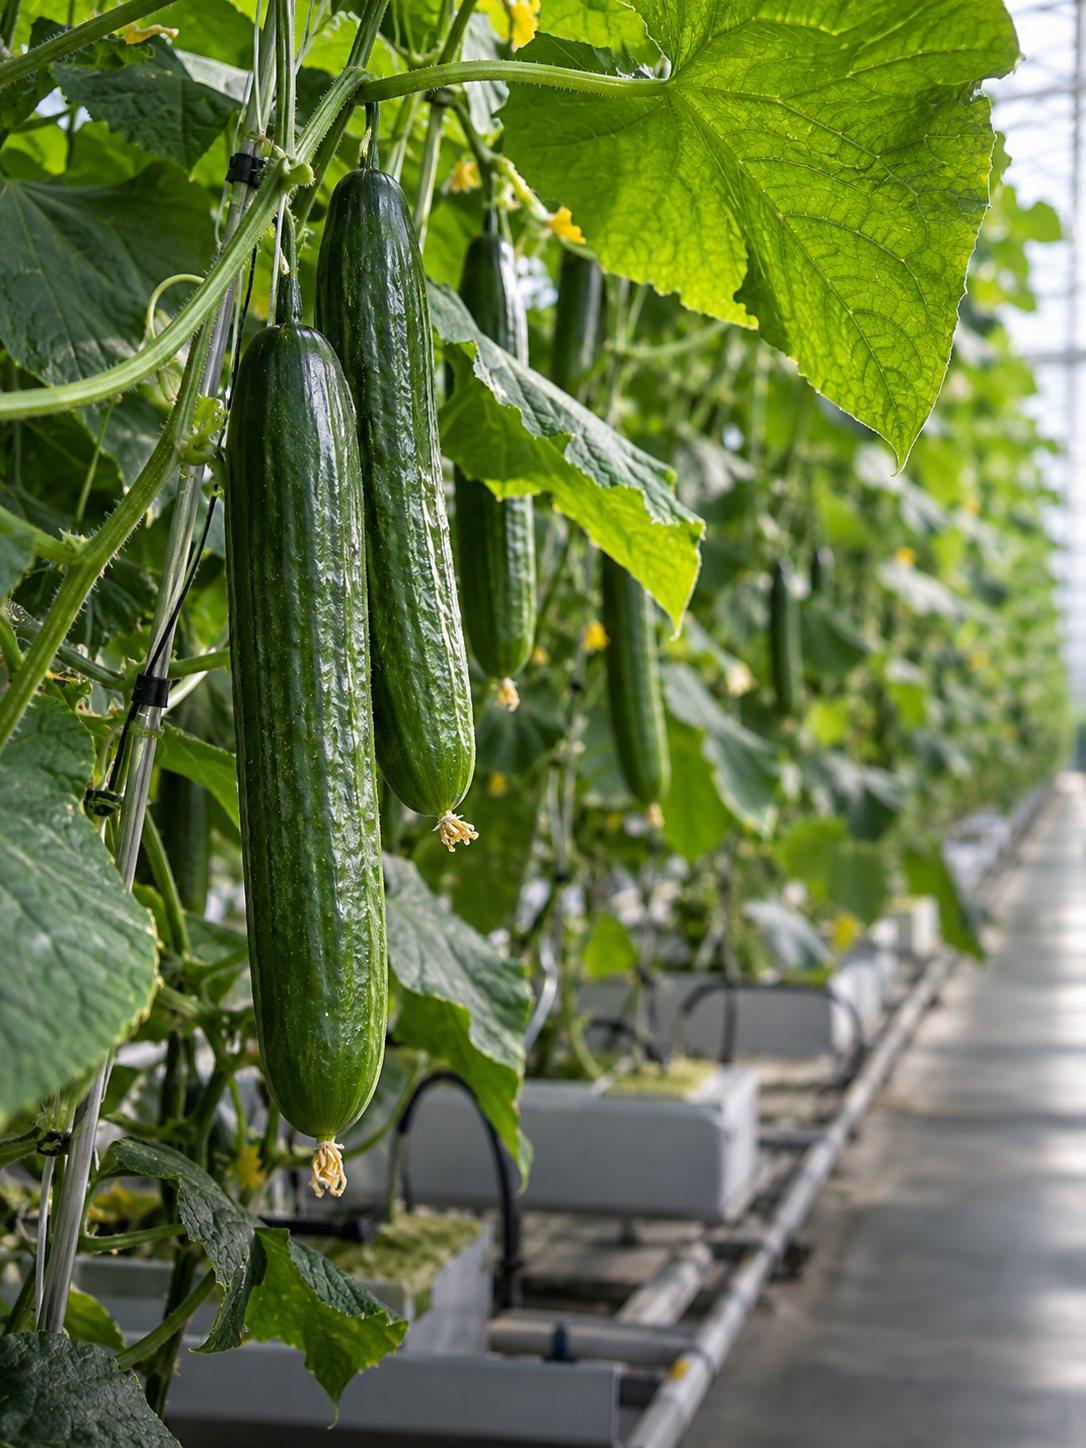 PP-CASE-001
CUCUMBER · VAN GOG
ALL12 | Kas 3 and Afdeling 12, Helmond | rockwool on perlite | Sept 2025 – Feb 2026 | 65 measurements, Eurofins Agro Wageningen
The report ranks silicon as the strongest result. Iron in the drain rose 243%; the report calls mobilisation from the substrate probable and says further work is needed. Brix in young leaf averaged 5.73 °Brix after the switch, against 4.95 before (+16%), from three readings: 3.9, 6.0 and 7.3. The before/after comparison includes a change of season, which the report marks as a limit on the Brix and nitrogen readings.
48% → 94%
silicon uptake efficiency, irrigation water stable
11% → 86%
uptake efficiency, even with a higher P supply
PP-CASE-003CUCUMBER · PROEFSTATION
ALL12 | Proefstation voor de Groenteteelt, Sint-Katelijne-Waver | plant sap and fruit | sampled 16 June 2026 | NovaCropControl
For these nutrients the difference between the objects sits mainly in the fruit, the harvested part, and not in the leaf. In the young leaf, most parameters of both objects fell inside NovaCropControl's target range. Zinc and silicon moved from below that range in the control to inside it with ALL12.
+23%
young leaf −37%, old leaf −25%
+8%
young leaf −6%, old leaf −3%
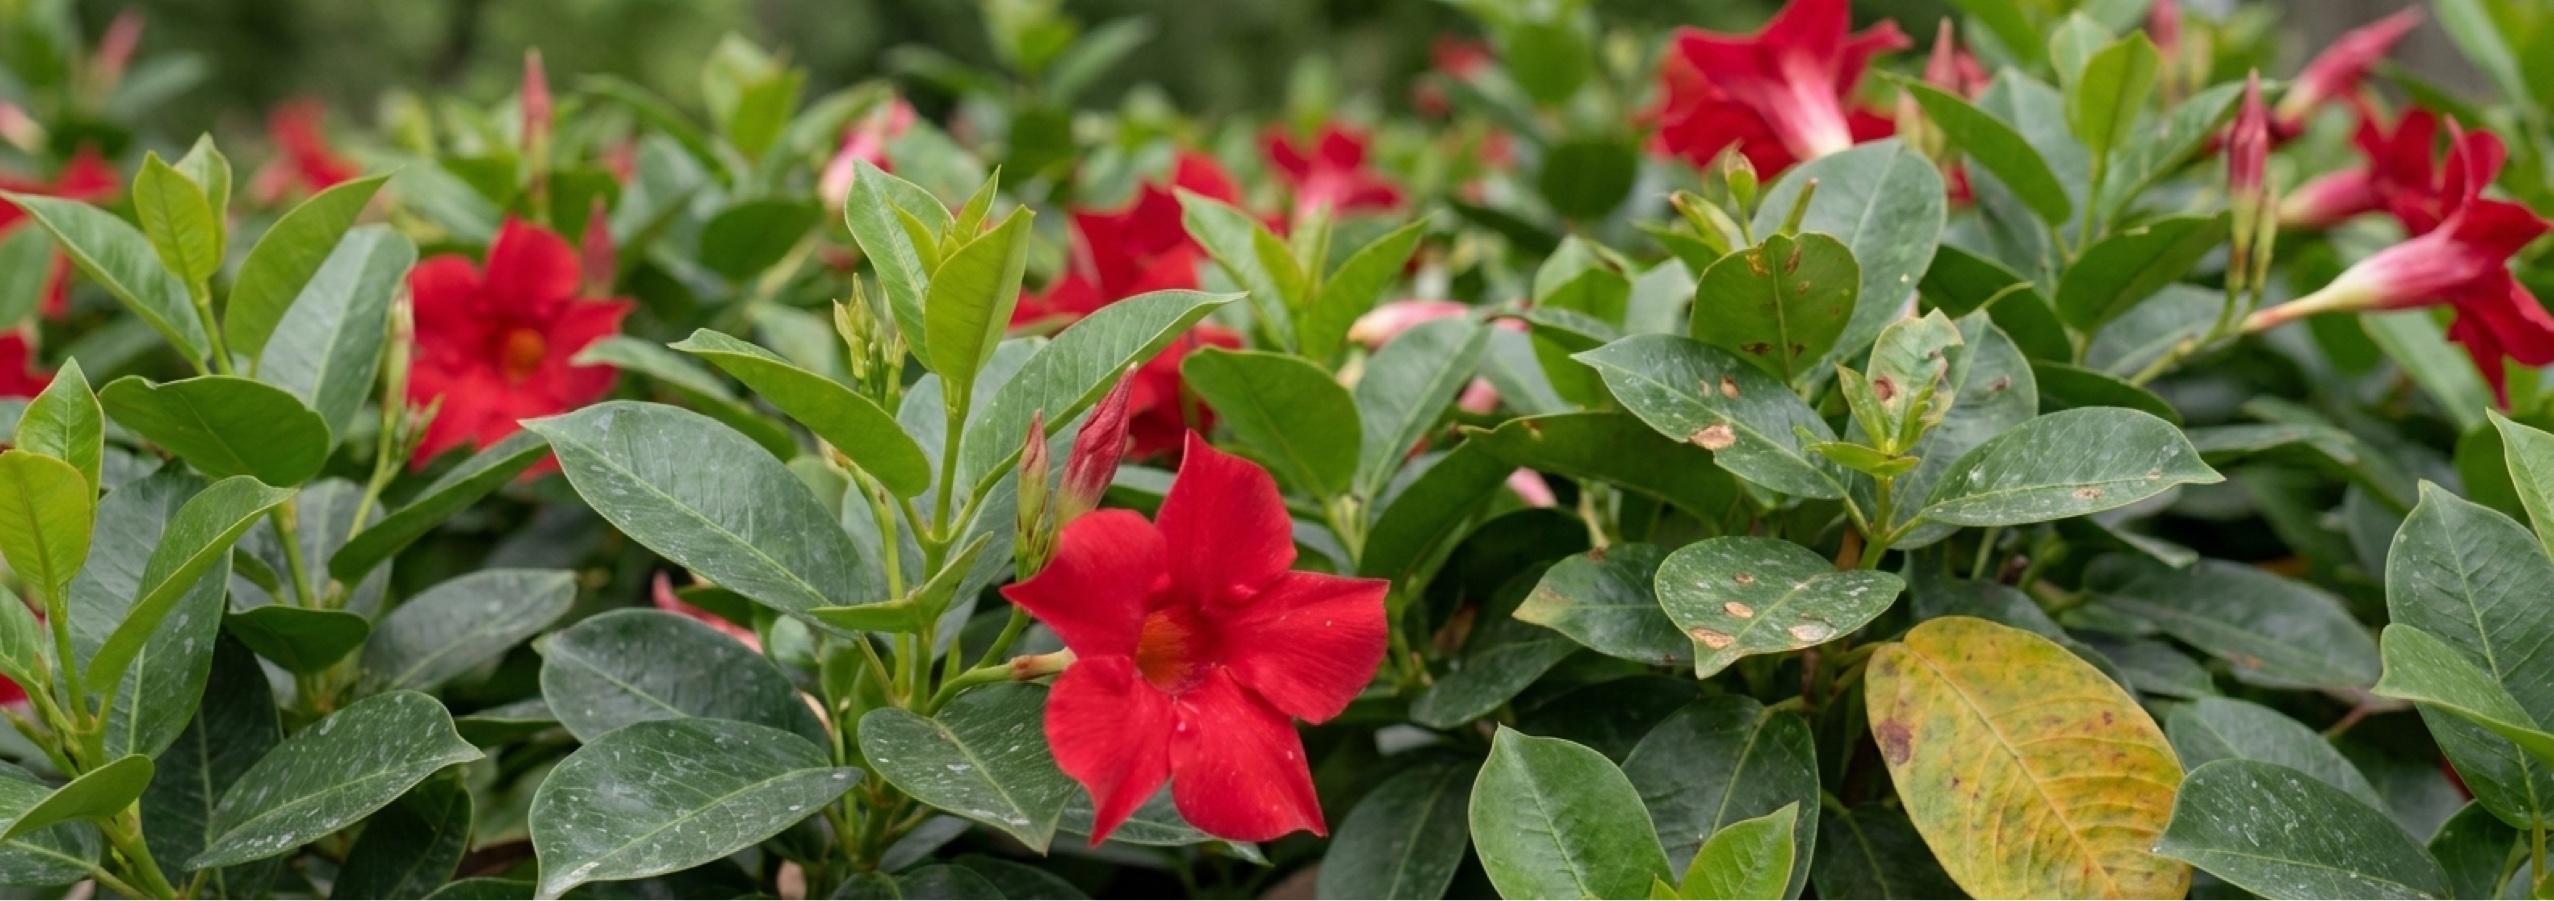 PP-CASE-002
DIPLADENIA · UGANDA
ALL12 | Qdeville Samba, glasshouse 104 | 25 May – 8 July 2026 | dry matter, CROPNUTS
From deficiency into the range without overshooting: no element went above the maximum.
4 → 0
elements below the Graff minimum
11/12
nutrients by ≥ 20%
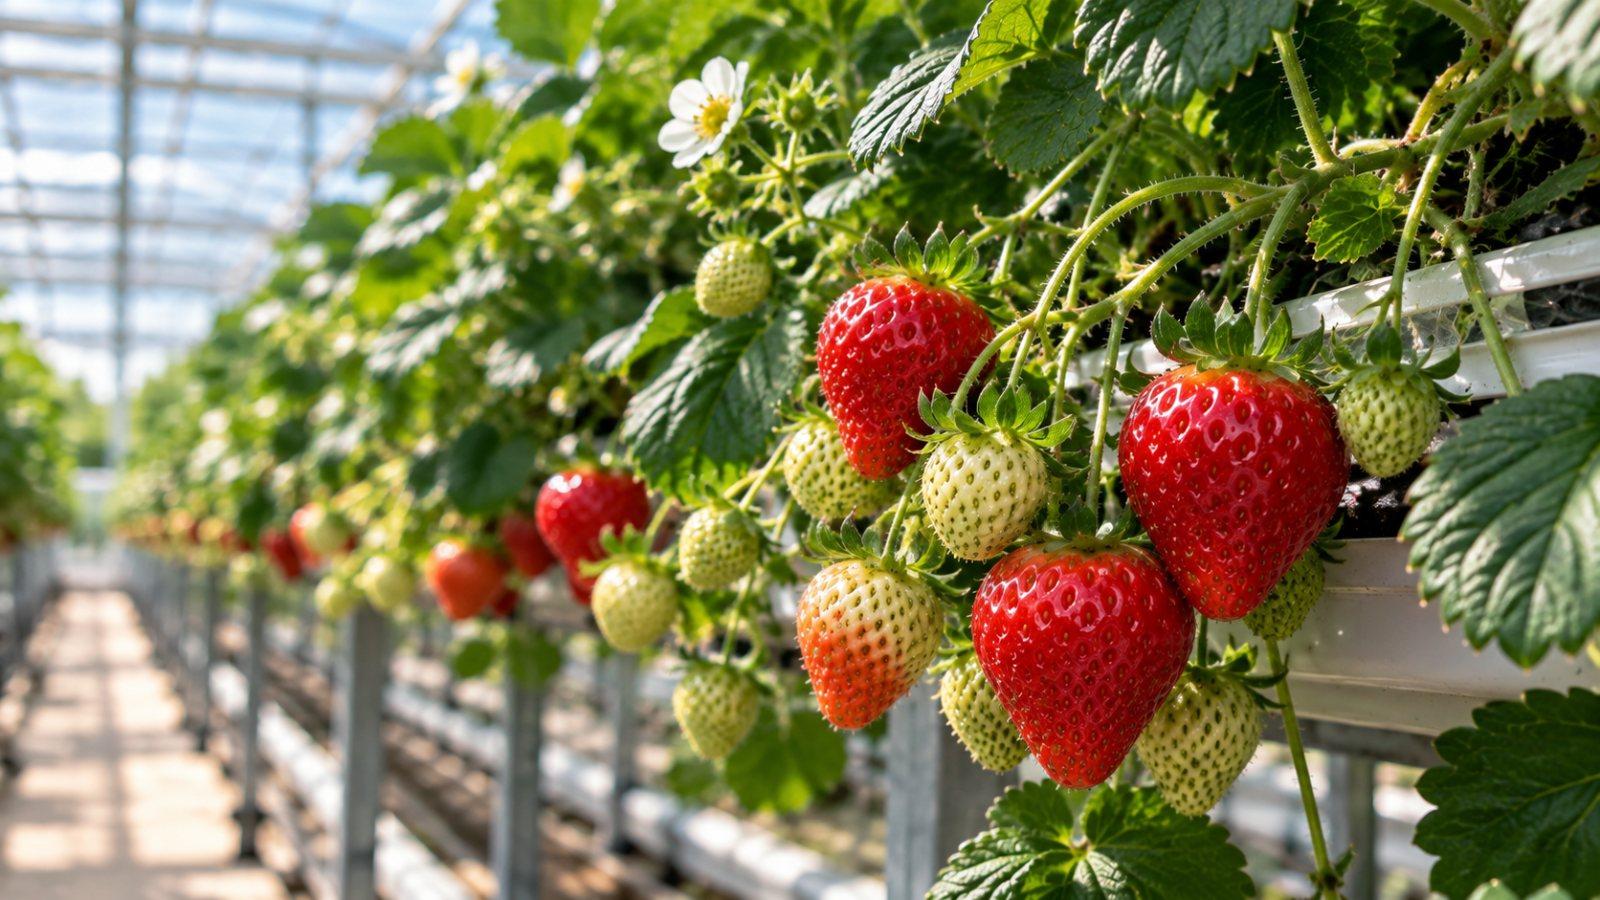 PP-CASE-004
STRAWBERRY · NETHERLANDS
ALL12 | Malling Centenary | BVB Strawberry Excellent | 28 Mar – 27 Apr 2026 | 50 L/ha + 12.5 L/week | NovaCropControl
The clearest contrasts are where the supply fell and the young-leaf sap still rose: calcium and nitrate. Harvest figures are not in this report; the document says they follow in Q3 2026.
+405%
young leaf, 541 to 2,732 ppm, on 20% less Ca via irrigation. Control +149%. At the end, 41% less Ca than the control.
+184%
on 46% less N via irrigation. Control +84%. Drain nitrate −22% (control +13%).
Four levels of evidence
Not every result carries the same weight. That is why each case states what kind of evidence sits underneath it.
- 1
Grower experience
What growers see
- 2
Field trial
Treatment next to a reference
- 3
Plant sap analysis
Independent laboratory
- 4
Research
Institute or university
How we work
Every trial sets out in advance what we test, how we measure and when we evaluate. The measurements are carried out by an independent laboratory.